 srcmini
使用Microsoft Excel打开时, PHPExcel生成的excel文件不起作用(文件格式或扩展名无效)吗?如果你是这个可怕问题的受害者, 则可能有很多因素导致此消息。
如果你使用的是纯PHP, 则使用以下代码:
$excelWriter->save("php://output");
Mark Baker(PHPOffice开发人员)说:
检查你的脚本, 以查看将其发送到php:// output流的位置。检查初始<?php开头标记之前是否没有空格;特别要注意?> <?php或类似的关闭/打开标签。并检查脚本可能包含的所有文件。在这里阅读更多
这是很难实现的, 因为很难检查标记之间的文件之间是否有空格(如果你使用的是symfony之类的框架, 这将是一项艰巨的任务), 但是有些开发人员使用:
ob_end_clean(); // ob_end_clean Cleans the output buffer and turn off output buffering
$excelWriter->save("php://output");
如果先前的解决方案对你不起作用, 那么你只剩下一个选择, 但是在继续之前, 你应该了解一些重要的注意事项:
- 流式响应几乎总是会生成损坏的文件。
- PHPExcel可能不是损坏文件的唯一罪魁祸首, 在大多数情况下, 你的代码(绘制数据的方式)可能已损坏。
- 使用save方法将文件保存在服务器中的某个位置, 然后根据需要生成文件下载(直接或间接)。
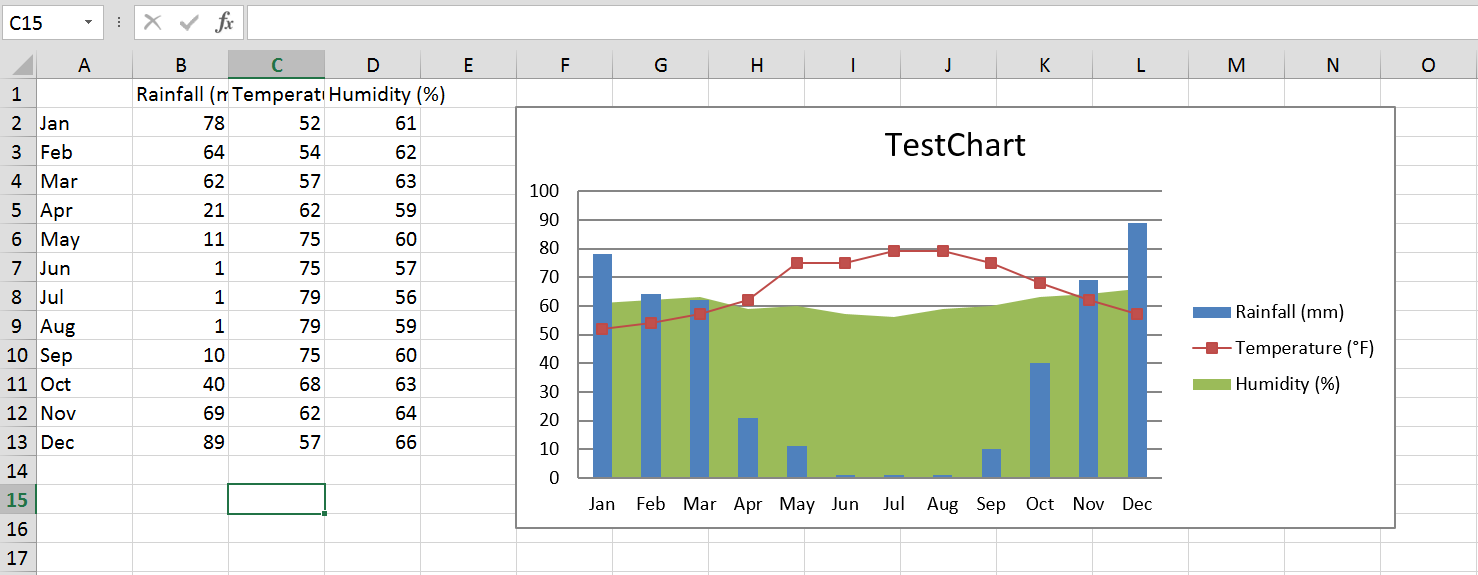
以下代码将使用基本图表示例创建一个不会损坏的excel文件, 请对其进行测试:
// Remove the \ before every class if you're using plain php ( new \PHP_Something)
public function createexcelfileAction() {
        // if you are using plain php use instead,         //$excel = new PHPExcel();

        $excel = $this->get('phpexcel')->createPHPExcelObject();

        $excel->createSheet();
        $excel->setActiveSheetIndex(1);
        $excel->getActiveSheet()->setTitle('ChartTest');


        $objWorksheet = $excel->getActiveSheet();
        $objWorksheet->fromArray(
                array(
                    array('', 'Rainfall (mm)', 'Temperature (°F)', 'Humidity (%)'),                     array('Jan', 78, 52, 61),                     array('Feb', 64, 54, 62),                     array('Mar', 62, 57, 63),                     array('Apr', 21, 62, 59),                     array('May', 11, 75, 60),                     array('Jun', 1, 75, 57),                     array('Jul', 1, 79, 56),                     array('Aug', 1, 79, 59),                     array('Sep', 10, 75, 60),                     array('Oct', 40, 68, 63),                     array('Nov', 69, 62, 64),                     array('Dec', 89, 57, 66),                 )
        );


        //  Set the Labels for each data series we want to plot
        //      Datatype
        //      Cell reference for data
        //      Format Code
        //      Number of datapoints in series
        //      Data values
        //      Data Marker
        $dataseriesLabels1 = array(
            new \PHPExcel_Chart_DataSeriesValues('String', 'Grafico!$B$1', NULL, 1), //  Temperature
        );
        $dataseriesLabels2 = array(
            new \PHPExcel_Chart_DataSeriesValues('String', 'Grafico!$C$1', NULL, 1), //  Rainfall
        );
        $dataseriesLabels3 = array(
            new \PHPExcel_Chart_DataSeriesValues('String', 'Grafico!$D$1', NULL, 1), //  Humidity
        );

        //  Set the X-Axis Labels
        //      Datatype
        //      Cell reference for data
        //      Format Code
        //      Number of datapoints in series
        //      Data values
        //      Data Marker
        $xAxisTickValues = array(
            new \PHPExcel_Chart_DataSeriesValues('String', 'Grafico!$A$2:$A$13', NULL, 12), //  Jan to Dec
        );


        //  Set the Data values for each data series we want to plot
        //      Datatype
        //      Cell reference for data
        //      Format Code
        //      Number of datapoints in series
        //      Data values
        //      Data Marker
        $dataSeriesValues1 = array(
            new \PHPExcel_Chart_DataSeriesValues('Number', 'Grafico!$B$2:$B$13', NULL, 12),         );

        //  Build the dataseries
        $series1 = new \PHPExcel_Chart_DataSeries(
                \PHPExcel_Chart_DataSeries::TYPE_BARCHART, // plotType
                \PHPExcel_Chart_DataSeries::GROUPING_CLUSTERED, // plotGrouping
                range(0, count($dataSeriesValues1) - 1), // plotOrder
                $dataseriesLabels1, // plotLabel
                $xAxisTickValues, // plotCategory
                $dataSeriesValues1                              // plotValues
        );
        //  Set additional dataseries parameters
        //      Make it a vertical column rather than a horizontal bar graph
        $series1->setPlotDirection(\PHPExcel_Chart_DataSeries::DIRECTION_COL);


        //  Set the Data values for each data series we want to plot
        //      Datatype
        //      Cell reference for data
        //      Format Code
        //      Number of datapoints in series
        //      Data values
        //      Data Marker
        $dataSeriesValues2 = array(
            new \PHPExcel_Chart_DataSeriesValues('Number', 'Grafico!$C$2:$C$13', NULL, 12),         );

        //  Build the dataseries
        $series2 = new \PHPExcel_Chart_DataSeries(
                \PHPExcel_Chart_DataSeries::TYPE_LINECHART, // plotType
                \PHPExcel_Chart_DataSeries::GROUPING_STANDARD, // plotGrouping
                range(0, count($dataSeriesValues2) - 1), // plotOrder
                $dataseriesLabels2, // plotLabel
                NULL, // plotCategory
                $dataSeriesValues2                              // plotValues
        );


        //  Set the Data values for each data series we want to plot
        //      Datatype
        //      Cell reference for data
        //      Format Code
        //      Number of datapoints in series
        //      Data values
        //      Data Marker
        $dataSeriesValues3 = array(
            new \PHPExcel_Chart_DataSeriesValues('Number', 'Grafico!$D$2:$D$13', NULL, 12),         );

        //  Build the dataseries
        $series3 = new \PHPExcel_Chart_DataSeries(
                \PHPExcel_Chart_DataSeries::TYPE_AREACHART, // plotType
                \PHPExcel_Chart_DataSeries::GROUPING_STANDARD, // plotGrouping
                range(0, count($dataSeriesValues2) - 1), // plotOrder
                $dataseriesLabels3, // plotLabel
                NULL, // plotCategory
                $dataSeriesValues3                              // plotValues
        );


        //  Set the series in the plot area
        $plotarea = new \PHPExcel_Chart_PlotArea(NULL, array($series1, $series2, $series3));
        //  Set the chart legend
        $legend = new \PHPExcel_Chart_Legend(\PHPExcel_Chart_Legend::POSITION_RIGHT, NULL, false);

        $title = new \PHPExcel_Chart_Title('Chart awesome');

        //  Create the chart
        $chart = new \PHPExcel_Chart(
                'chart1', // name
                $title, // title
                $legend, // legend
                $plotarea, // plotArea
                true, // plotVisibleOnly
                0, // displayBlanksAs
                NULL, // xAxisLabel
                NULL            // yAxisLabel
        );

        //  Set the position where the chart should appear in the worksheet
        $chart->setTopLeftPosition('F2');
        $chart->setBottomRightPosition('O16');

        //  Add the chart to the worksheet
        $objWorksheet->addChart($chart);


        // if you're using plain php use instead :
        // $writer = new PHPExcel_Writer_Excel2007($excel);
        $writer = $this->get('phpexcel')->createWriter($excel, 'Excel2007');
        $writer->setIncludeCharts(TRUE);

        // Save the file somewhere in your project
        $writer->save('file.xlsx');
        // then your file will be not corrupted anymore

        // Do not use streamed responses with excel files that include charts ! otherwise it will get corrupted
        /**
          $response = $this->get('phpexcel')->createStreamedResponse($writer);
          // adding headers
          $dispositionHeader = $response->headers->makeDisposition(
          ResponseHeaderBag::DISPOSITION_ATTACHMENT,           'stream-file.xlsx'
          );
          $response->headers->set('Content-Type', 'text/vnd.ms-excel; charset=utf-8');
          $response->headers->set('Pragma', 'public');
          $response->headers->set('Cache-Control', 'maxage=1');
          $response->headers->set('Content-Disposition', $dispositionHeader);
        **/

        // YOU NEED TO GIVE YOUR OWN RESPONSE, OTHERWISE THIS WILL THROW ERROR
        return 'Create your own response';
}
如果一切正常, 则生成的excel文件将是具有以下内容的普通excel文件(并且没有损坏的文件消息):
现在一切都应该井井有条, 但是你需要测试使用save方法(而不是流式响应)保存文件的代码。
如果文件仍然损坏, 则绝对应该重新评估代码, 并检查是否使用感知数据进行渲染, 因为这可能是问题所在。
如果你在此处访问官方的phpexcel github存储库, 则可以获取更多图表示例, 其中有许多示例说明了如何使用不同类型的图表。愿原力与你同在 !
评论前必须登录!
注册